Filtering duplicate data points on Chart.js
With large data sets, Chart.js data points can start to look cluttered and impact performance. This article looks at how these could be filtered.
What is Chart.js?
Chart.js is an open-source library which provides simple and flexible Javascript charting.
There is also an npm package, react-chartjs-2, which provides Chart.js as React components.
Duplicate data points
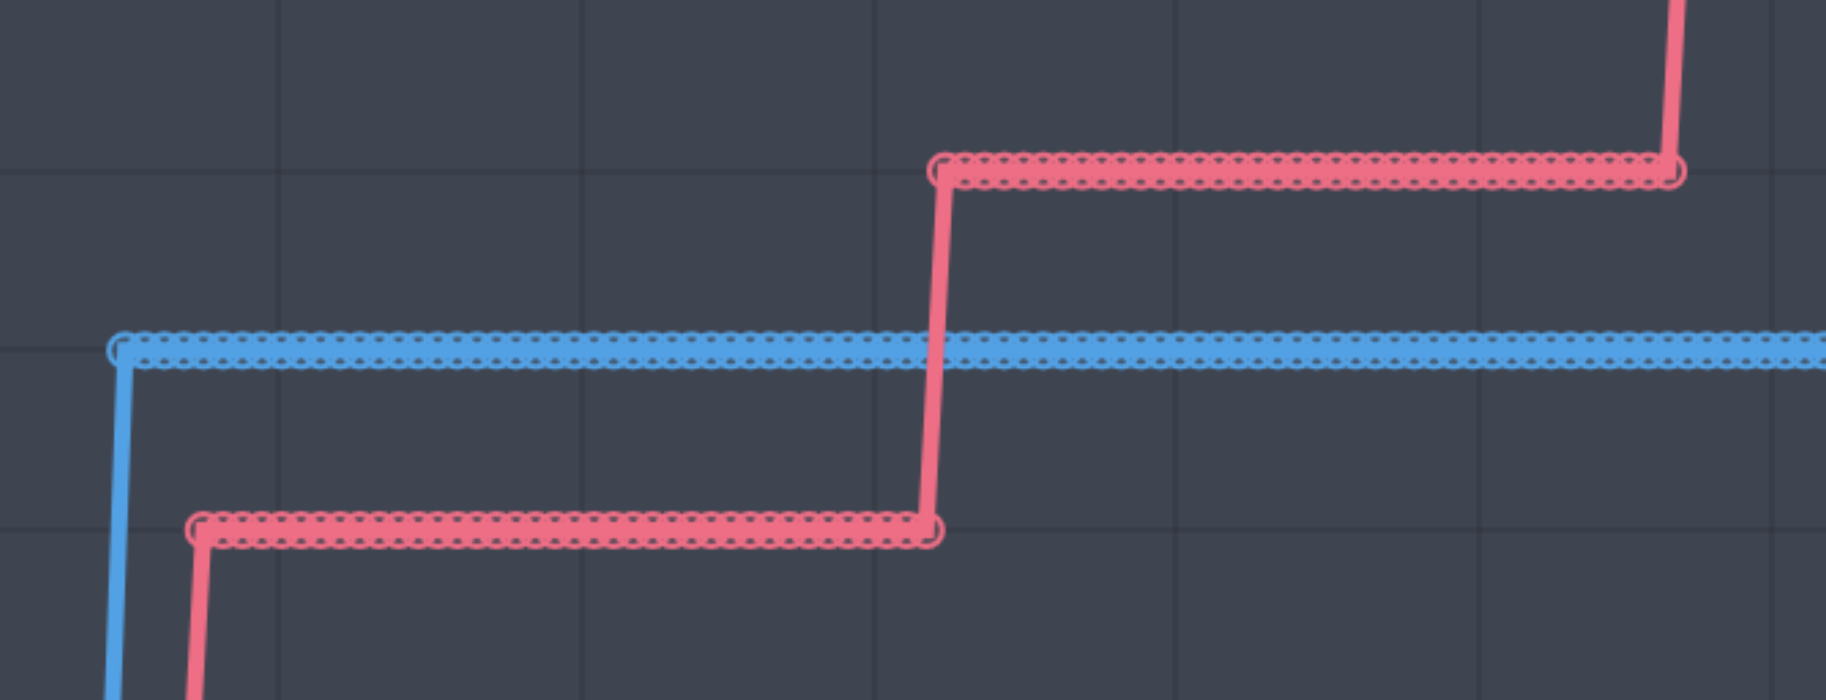
When using a line chart with a lot of data and unchanging values on the y-axis, there can be a lot of overlapping data points, which aren't providing much value to the user:

Filtering duplicate data points
To remove these duplicate data points, we can use a mapping function that only returns data points which have different values on the y-axis to their adjacent values:
export interface Dataset {
  borderColor?: string;
  backgroundColor?: string;
  label: string;
  data: Array<{ x: number; y: number; }>
}

export function filterData(datasets: Array<Dataset>): Array<Dataset> {
  return datasets.map((dataset) => ({
    ...dataset,
    data: dataset.data.filter((d, i) => {
      const previousD = dataset.data[i - 1];
      const nextD = dataset.data[i + 1];

      // return true if there is no previous or next data point
      if (!previousD || !nextD) return true;

      // only return true if the previous and next data points
      // are different to the current value
      return !(previousD.y === d.y && nextD.y === d.y)
    })
  }))
}
Wrapping the datasets with the filterData function will then input less data to the Chart component, and simplify the points displayed in the UI:

Example
An example Next.js application is available to download and run locally here:
https://github.com/curtiscde/examples/tree/main/chartjs-remove-duplicates
$ npm install
$ npm run dev
🌐 Demo
https://chartjs-filterdata.curtiscode.dev


